
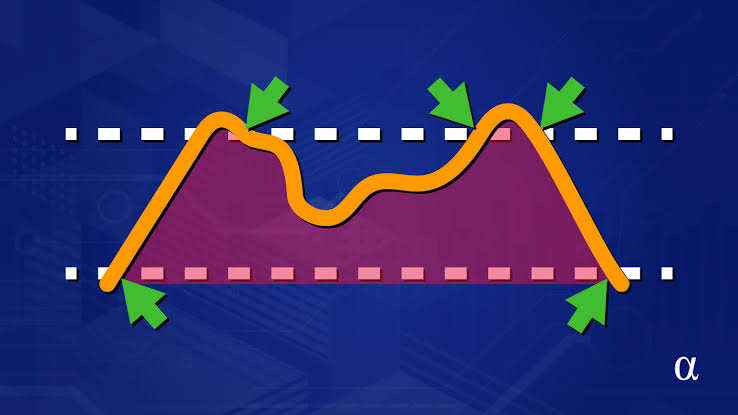
Investing in stock markets can often feel like trying to navigate a maze. With numerous metrics, indicators, and strategies, it can be daunting for both beginners and experienced traders to understand it all. One such essential tool in a trader’s arsenal is the Relative Strength Index (RSI). So, what is the Relative Strength Index, and how can you use it to enhance your trading journey? Let’s dive in!
What is the Relative Strength Index?
In simple terms, the Relative Strength Index is a popular technical indicator used to measure the speed and change of price movements. It’s designed to identify overbought or oversold conditions of a stock. The RSI ranges from 0 to 100, with readings above 70 typically indicating an overbought situation and readings below 30 indicating an oversold condition. Traders often use the Relative Strength Index to spot potential reversal points in a stock’s price.
How is the Relative Strength Index Calculated?
Calculating the Relative Strength Index may sound complicated, but it’s quite straightforward. Here’s how to do it:
1. Choose a time period
The default setting for the RSI is usually 14 periods. This could be 14 days, weeks, or even hours, depending on your trading style.
2. Calculate average gain and average loss
For the chosen period, calculate the average gains and losses. This involves finding the average of the gains during the up days and the average of the losses during the down days.
3. Calculate Relative Strength (RS)
This is simply the average gain divided by the average loss.
4. Finally, calculate the RSI
Use the formula:
[
RSI = 100 – \left( \frac{100}{1 + RS} \right)
]
And voilà! You now have the Relative Strength Index value.
Understanding the Significance of Levels
The levels of the Relative Strength Index offer valuable insights:
- Above 70: This suggests the stock might be overbought. Now, what does that mean for you? If you’re holding that stock, it could be a good time to consider selling or at least monitoring for any signs of downturn.
- Below 30: This indicates that the stock may be oversold. For a savvy investor, this can be a golden opportunity to buy at a lower price before a potential recovery.
The beauty of the Relative Strength Index lies in its ability to provide a quick glance at market sentiment.
Practical Applications of the Relative Strength Index
1. Identifying Trend Reversals
Traders often rely on the RSI to pinpoint when a trend may be about to change. For instance, if a stock is in a strong uptrend but the RSI reaches above 70, it could signal an impending reversal. Conversely, if a stock is in a downtrend and the RSI dips below 30, it might indicate a reversal to the upside.
2. Confirming Price Movements
The Relative Strength Index is also used to confirm trends. If a stock is making new highs and the RSI is also climbing, it supports that the trend is strong. However, if the price hits a new high while the RSI begins to decline, it may suggest that the upward momentum is waning.
3. Spotting Divergences
Divergences are one of the most potent signals produced by the Relative Strength Index. A bullish divergence occurs when prices are making new lows, while the RSI is making higher lows. This is a classic signal that a reversal to the upside could be on the horizon. On the flip side, a bearish divergence occurs when the price is making higher highs but the RSI is making lower highs, suggesting a potential downturn.
4. Generating Buy and Sell Signals
Many traders set specific thresholds within the Relative Strength Index for buy and sell signals. For example, a trader might decide to buy when the RSI crosses back above 30 after being oversold and sell when it crosses back below 70 after being overbought. This can create a systematic trading strategy based on objective data.
The Relative Strength Index in Relation to Other Indicators
While the Relative Strength Index is a powerful tool, it shouldn’t be used in isolation. Integrating it with other indicators can improve decision-making. For instance, you can combine the RSI with moving averages to determine overall trends, or look at a stock’s Earnings per Share (EPS) to understand its fundamental performance.
The Earnings per Share is another significant metric in evaluating a company’s profitability. When analyzing a stock, having both the RSI and EPS can provide a more comprehensive view of the potential for price movements. If a company has rising EPS and a low RSI, it could present an excellent buying opportunity!
Common Mistakes to Avoid
Just like any other trading tool, using the Relative Strength Index has its pitfalls. Here are some typical mistakes to watch out for:
1. Ignoring the Larger Trend
It’s essential to consider the primary trend of the stock or market. Relying solely on RSI signals without looking at overall market conditions can lead to poor decisions.
2. Overtrading
Some traders may react too quickly to the RSI signals, leading to overtrading. It’s crucial to maintain discipline and stick to a well-defined strategy.
3. Relying Solely on the Indicator
As we’ve mentioned, the Relative Strength Index is best used in conjunction with other indicators. Avoid making decisions based solely on RSI readings.
Final Thoughts
In conclusion, the Relative Strength Index is a valuable tool for any trader looking to understand market momentum. Whether you are a novice crossing your first steps into trading or a seasoned expert honing your skills, grasping the concept and applications of the RSI can be a game-changer.
Remember, while the Relative Strength Index can indicate whether a stock might be overbought or oversold, it’s crucial to consider broader market contexts, incorporate other indicators like Earnings per Share, and maintain a disciplined approach to trading. So, gear up and allow the Relative Strength Index to enhance your trading toolbox—it could very well lead you to the right path in your investment journey!